A magnifying glass icon is centered on a smooth, blue background with a subtle sparkling texture, suggesting themes of investigation and exploration.

Insight

Data at your fingertips, empowering better decisions

The challenges faced by DB scheme trustees are only increasing, so trustees are asking questions of themselves. How do we improve the effectiveness of our strategy? How can we lower costs? The answers lie in making your pension scheme data work for you.

Insight, our online dashboard for trustees, is designed to make your pension scheme analytics available to you, presented in a clear way that allows instant analysis.
 

"Insight is a truly innovative and forward-thinking development from Barnett Waddingham. It provides the most comprehensive and up to date scheme information from any administrator."
Mike Smaje Trustee Executive, BESTrustees

Our Insight tool will

  • Provide on-demand secure access to a summary of your scheme’s data.
  • Allow you to query the data summaries, in your own time and with your own filters, so you can better understand your own data.
  • Allow trustees and consultants to spot trends or other interesting features early, improving decision making time.
  • Provide better transparency, as all data is taken directly from our systems.
  • Allow everyone to work with the same tool, leading to smoother and clearer communication between trustees and administrators.
  • Enable queries to be answered outside of the normal meeting cycle, in particular questions that are not business as usual.

Insight's features and capabilities are increasing all the time, with the below just being part of the initial release.

  • Volume of work and our performance measured against our service level agreement.
  • The scheme's membership breakdown and the member movements over time.
  • The age that members have been retiring, and the type of retirement they've taken.
  • The age profile of the membership.
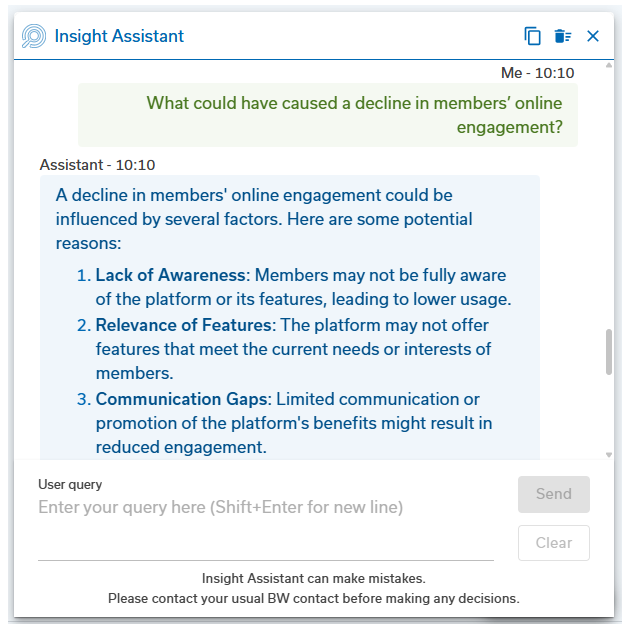
  • Member online activity (e.g. number of members logging in to member websites).
  • What was the effect of the Covid pandemic on the scheme’s membership? 
  • How much scope is there to pay out benefits for members with small savings? 
  • How many members are taking cash at retirement? 
  • With a change in interest rates, has this led to a change in members taking transfer values to other schemes? 
  • How is the administration team performing? 
  • What is the take up of online services? 

A digital dashboard displays service level agreement metrics, member movement data, and case type breakdowns, featuring graphs and charts for performance analysis over specific time periods.


Example dashboard view:

A digital tablet displays data analytics for a pension scheme, showcasing service level agreements through bar graphs and pie charts, alongside detailed task breakdowns in a structured table format.
A woman in a white shirt is holding a blue mug and looking at her smartphone. She stands near a window in a modern, light-filled office environment.

Speak to our experts

To find out more about how our expertise can support your needs, please contact our team.

New business enquiries